

核心要点
受供需格局整体变动提振,澳大利亚 5 月肉牛价格全线反弹。
大范围降雨推升补栏采购需求,肉牛出栏货源收紧,带动肉价大幅走高。
即便屠宰量维持高位,出栏量偏少叠加内外销需求旺盛,支撑牛价稳居高位。
自 3 月中旬持续走低后,澳大利亚肉牛价格 5 月大幅反弹。行情变动源于供需格局逆转:降雨提振养殖户信心、肉牛上市量缩减,补栏、育肥及屠宰采购商同步入市拿货。
本轮涨价的突出特点是全品类普涨,并非单一品类拉动。犊牛、育肥牛、母牛报价全线走强,全国犊牛活重指数达 508.9 澳分 / 公斤,创 2022 年以来新高。全品类同步上行说明本轮涨价受基本面实质性变化支撑,并非短期投机采购所致。
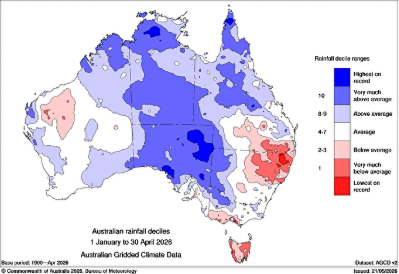
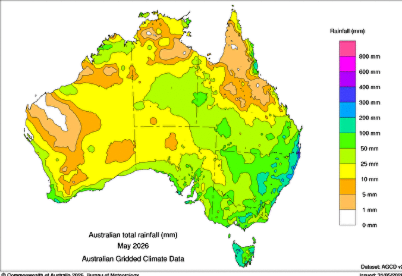
图 1:2026 年 1-4 月降水十分位分布及 5 月月度降水量
数据来源:澳大利亚气象局
降雨是本轮行情短期驱动因素。5 月下旬澳大利亚全境普遍降雨,新南威尔士州北部、昆士兰州南部等干旱重点区域降水充沛。降雨带动补栏采购热情、肉牛上市货源减少。各地市场竞拍竞争加剧,多地交易市场犊牛单日报价大幅冲高,采购商抢收偏小体重牛只,抢抓饲草改善窗口期。以沃加沃加市场为例,补栏周岁阉牛活重指数周环比大涨 40 澳分,5 月以来累计上涨 122 澳分,现价升至 594 澳分 / 公斤。
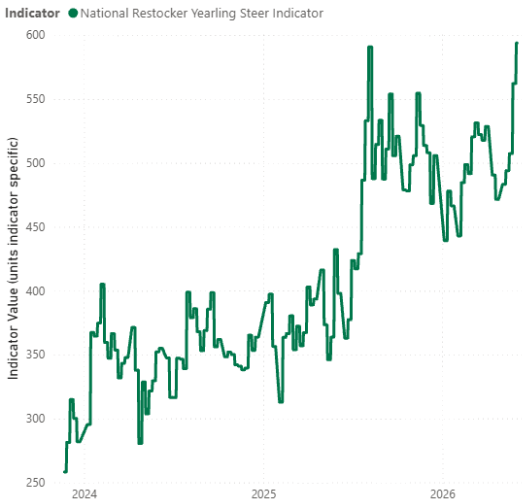
图 2:沃加沃加交易市场补栏周岁阉牛价格指数
数据来源:澳大利亚国家牲畜行情服务中心
地区价差同步拉大。新南威尔士州涨幅居前,沃加沃加、辛格尔顿、塔姆沃思、福布斯等交易市场受降水利好、出栏量下滑影响,补栏客商竞价火热。昆士兰州行情同样坚挺,州内中南部牛价走高,依托本地补栏与屠宰企业双重采购需求。
货源收缩同样助推行情。年初肉牛集中出栏过后,受气候不确定性与本土需求回暖影响,养殖户暂缓出栏,上市量逐步回落。步入冬季,育肥场、补栏端需求保持旺盛,货源缩减直接拉动牛价快速上行。
供需搭配重塑市场逻辑:高屠宰量未必打压行情。本轮屠宰产能由出口订单完全承接,即便屠宰存栏维持高位,牛价依旧上行。简言之,4 月由货源主导的市场格局,在 5 月切换为需求托底。
撰稿:澳大利亚肉类与畜牧业协会资深市场分析师埃米利亚诺・迪亚斯
信息截至 2026 年 6 月 4 日撰稿当日有效
澳大利亚肉类及畜牧业协会(MLA)不对本刊物所载任何信息的准确性、完整性及时效性作出任何保证。用户使用或依赖本刊物任何内容,风险自行承担;因使用或依赖相关信息所造成的任何损失与损害,MLA概不承担任何责任。未经MLA事先书面许可,本刊物任何内容不得擅自转载、复制。凡使用MLA刊物、报告及相关信息,均须遵守MLA市场报告及信息使用条款。
消息来源:MLA
Sharp rebound for May cattle prices
Key points
Australian cattle prices rebounded in May due to a broad supply-demand shift lifting all market segments.
Widespread rainfall boosted restocker demand while tightening cattle supply and driving sharp price rises.
Lower yardings and strong domestic and export demand are sustaining higher prices despite solid slaughter levels.
Australian cattle prices rebounded sharply in May after trending lower since mid-March. The shift reflects a classic supply-and-demand pivot: rain improved producer sentiment, cattle yardings tightened, and buyers for restocking, feeding and processing all came back into the market at the same time.
The most striking feature of the move is that it hasn’t been driven by one segment alone. Indicators across young cattle, feeder cattle and cows have all strengthened, and the National Young Cattle Indicator has reached $508.9c/kg liveweight (lwt), the highest level since 2022. That broad-based lift suggests the market is not simply reacting to one-off buying interest, but to a genuine shift in fundamentals.
Figure 1: Rain decile from January to April 2026 and the monthly rain in May
Source: BOM
Rain was the immediate catalyst. In late May, widespread falls were recorded across the country, particularly in north NSW and southern Queensland, where they were most needed. This boosted restocker activity and reduced the number of cattle being offered. Market reports claim stronger competition almost everywhere, with some saleyards recording very large one-day jumps in young cattle prices as buyers chased lighter lines before paddock feed and confidence tightened further. For instance, the Restocker Yearling Steer Indicator jumped from 40¢ at Wagga week-on-week and 122¢ since the beginning of May, reaching a premium price to 594¢/kg lwt.
Figure 2: Restocker Yearling Steer Indicator – Wagga Wagga saleyard
Source: NLRS
Regional spreads have also widened. NSW has recorded some of the sharpest gains, especially in yards such as Wagga, Singleton, Tamworth and Forbes, where rain and lower numbers triggered aggressive restocker competition. Queensland has been firm too, with strong cattle prices in southern and central areas reflecting both local restocking interest and processor demand.
Supply has also been doing a lot of the work. After a heavy run of cattle earlier in the year, numbers available for sale eased as producers responded to seasonal uncertainty and stronger local demand. Lower yardings matter because the market has been running into winter with active feedlot and restocker demand still intact, which means fewer cattle available can quickly translate into much stronger prices.
That combination is important: high slaughter does not automatically mean weaker prices. In this case, strong processing throughput is being absorbed by export demand, which has allowed prices to rise even while kill numbers remain solid. In other words, the market has moved from being supply-led in April to demand-supported in May.
Attribute content to: Emiliano Diaz, MLA Senior Market Information Analyst.
Information is correct at time of writing on 4 June 2026.
MLA makes no representations as to the accuracy, completeness or currency of any information contained in this publication. Your use of, or reliance on, any content is entirely at your own risk and MLA accepts no liability for any losses or damages incurred by you as a result of that use or reliance. No part of this publication may be reproduced without the prior written consent of MLA. All use of MLA publications, reports and information is subject to MLA’s Market Report and Information Terms of Use.
Source:MLA

