

核心要点
澳大利亚气象局上周正式发布厄尔尼诺预警,但并未引发采购商恐慌。
数据显示,厄尔尼诺官方预警与肉牛价格之间不存在长期联动关系。
澳大利亚气象局(BOM)于上周正式宣布厄尔尼诺气候模式已形成。
从历史数据来看,厄尔尼诺现象通常伴随干旱天气,典型案例包括千年大旱以及2015年旱情,这类干旱会打击养殖户经营信心,改变市场季节性行情预期。
但需要重点注意的是,每一轮厄尔尼诺的影响程度各不相同,各地牧场实际经营状况差异极大。举例而言,2023年9月气象局官宣厄尔尼诺后,得益于全国大部分地区春末降雨充沛,当年养殖户受到的冲击相对温和。
厄尔尼诺通常会造成澳大利亚东部与北部部分区域高温少雨。但正如2023年的经验所示,干旱只是概率性结果,并非必然发生。
本周受近期大范围降雨提振,市场对本次厄尔尼诺预警反应平淡,多数肉牛价格指数出现上涨:一岁龄补栏阉牛指数涨幅达4%,仅重型阉牛指数小幅下跌1%。
气象监测数据对肉牛价格具备长期参考意义吗?
澳大利亚气象局通过多项气象观测指标判定厄尔尼诺或拉尼娜气候模式。其中两大核心监测指标分别为南方涛动指数(SOI)与尼诺3.4指数(Niño3.4):南方涛动指数用于测算塔希提岛与达尔文两地海平面气压差值;尼诺3.4指数则衡量国际日期变更线至南美洲沿岸海域的海水温度波动。
不过,回溯2000年至今的历史数据显示,上述两项核心气象指标与肉牛价格之间不存在统计学层面的显著关联。下表为南方涛动指数、尼诺3.4指数,分别对应全国青年肉牛指数、重型阉牛指数的相关系数。

指标采用月度均值,观测数据取月度统计值,统计区间:2000年1月—2026年5月
数据来源:澳大利亚肉类及畜牧业协会、澳大利亚气象局
若两组变量间存在具备统计显著性的关联,相关系数正数需大于0.3,负数需小于-0.3;区间在-0.3至0.3之间则代表二者无明显关联。分析全国青年肉牛指数、重型阉牛指数分别与南方涛动指数、尼诺3.4指数的对应关系后可见,各组变量均不具备统计显著相关性。
全国青年肉牛指数(NYCI)过往在厄尔尼诺 / 拉尼娜周期中表现如何?
下图展示2008年以来全国青年肉牛指数(NYCI)走势,并标注各轮厄尔尼诺、拉尼娜周期对照。
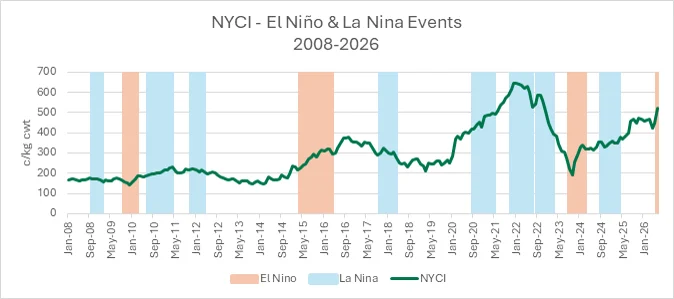
数据来源:澳大利亚肉类及畜牧业协会、澳大利亚气象局
正如前文相关系数数据所示,该指数走势与澳大利亚气象局发布的厄尔尼诺、拉尼娜预警之间不存在明显关联;相比之下,指数与整体市场供给格局的相关性更高。
供给格局与肉牛存栏周期是主导市场走势的核心因素
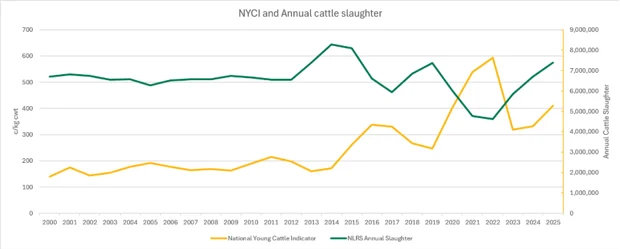
2000年以来,全国青年肉牛指数与年度肉牛屠宰量呈现出显著更强的联动关系。

各项指数采用年度均值,肉牛屠宰数据取自 2000 至 2025 年全国牲畜登记系统(NLRS)年度屠宰统计报表
数据来源:全国牲畜登记系统、澳大利亚肉类及畜牧业协会
上述数据显示全国青年肉牛指数(NYCI)与肉牛屠宰量呈中等负相关,即屠宰量走高时,该指数通常下行。重型阉牛指数也存在同类负相关,但关联性偏弱;这体现出长期以来,多由季节气候主导的市场供给会对价格形成影响。
全国青年肉牛指数采用年度均值,对应全国牲畜登记系统年度屠宰统计数据
数据来源:全国牲畜登记系统、澳大利亚肉类及畜牧业协会
尽管2026年屠宰量持续处于高位,但全国青年肉牛指数(NYCI)依旧上行。这说明当前市场行情受国内供给压力的影响减弱,需求端成为主导因素。全球肉牛供给偏紧、出口需求旺盛,加之澳大利亚能够稳定持续供货,共同支撑肉价走高。
信息供稿:澳大利亚肉类及畜牧业协会市场信息分析师 亚历克斯・弗莱
数据更新截至2026年6月25日
澳大利亚肉类及畜牧业协会(MLA)不对本刊物所载任何信息的准确性、完整性及时效性作出任何保证。用户使用或依赖本刊物任何内容,风险自行承担;因使用或依赖相关信息所造成的任何损失与损害,MLA概不承担任何责任。未经MLA事先书面许可,本刊物任何内容不得擅自转载、复制。凡使用MLA刊物、报告及相关信息,均须遵守MLA市场报告及信息使用条款。
消息来源:MLA
Do El Niño declarations really impact cattle markets?
Key points
BOM’s official El Niño declaration last week hasn’t spooked buyers.
No long-term relationship between El Niño declarations and cattle prices.
Last week, the Bureau of Meteorology (BOM) declared that an El Niño weather pattern had formed.
Historically, El Niño has had close associations with drought, notably The Millenium Drought and the 2015 drought. This can negatively impact producer sentiment and seasonal expectations.
However, it’s important to note that all El Niño events are different and conditions for producers are highly variable. For example, due to late spring rain for most of the country, the September 2023 El Niño declaration returned a relatively mild impact for producers.
El Niño events are typically associated with drier and warmer conditions across parts of eastern and northern Australia. However, as it was noted in 2023, these impacts are probabilistic rather than guaranteed.
This week, due to recent widespread rains markets seemingly ignored the El Niño declaration, with most cattle indicators lifting between 4% for the Restocker Yearling Steer Indicator and dropping 1% for the Heavy Steer Indicator.
Do weather readings hold long-term significance against cattle prices?
Several readings are used by BOM to determine an El Niño or La Niña pattern. Two key readings are the Southern Oscillation Index, which measures the difference in sea level pressure between Tahiti and Darwin and the Niño3.4 index, which measures changes in sea temperature between the International Date Line and the coast of South America.
Data going back to 2000, however, shows that these key readings hold no statistical significance in relation to cattle prices. Below is a table of the correlation coefficients between the Southern Oscillation Index and Niño3.4 and the National Young Cattle Indicator and Heavy Steer Indicator.
Monthly averages used for indicators with monthly readings used for observations – January 2000 to May 2026. Source: MLA, BOM.
For a relationship to be considered statistically significant between two variables, it must be at least greater than 0.3 (for positive correlation) or less than -0.3 (for negative correlation). Anything between these values means no relationship exists. When examining the relationship between the NYCI and Heavy Steer Indicators and the Southern Oscillation Index and Nino3.4, none of the variables holds a statistically significant relationship.
How has the NYCI previously responded to the El Niño/La Niña cycle?
The graph below tracks the NYCI since 2008, with El Niño and La Niña cycles called out against the indicator.
Source: MLA, BOM
As the earlier correlation coefficients suggest, there is no discernible relationship between the indicator’s movement and the BOM’s declarations of El Niño and La Niña. Instead, the indicator has a closer relationship with general supply dynamics.
Supply dynamics and the cattle cycle the dominant market driver
Since 2000, a much stronger relationship has manifested between the NYCI and annual cattle slaughter.
Annual averages used for Indicators with annual NLRS slaughter report numbers used for cattle slaughter from 2000 to 2025. Source: NLRS, MLA
The reading above shows a moderate negative relationship between the NYCI and cattle slaughter, meaning that as slaughter increases, the NYCI tends to fall. A similar but weaker relationship is shown to exist for the Heavy Steer Indicator, reflecting the influence that supply, often driven by seasonal conditions, has traditionally had on price.
Annual average used for NYCI against annual figures for NLRS slaughter report. Source: NLRS, MLA
Despite sustained high slaughter in 2026, the NYCI has continued to strengthen. This indicates that current market dynamics are being driven less by domestic supply pressure and more by demand. Tight global cattle supplies, strong export demand and Australia’s ability to maintain consistent product delivery have supported prices.
Attribute content to: Alex Fry, MLA Market Information Analyst.
Information is correct at the time of writing on 25 June 2026.
MLA makes no representations as to the accuracy, completeness or currency of any information contained in this publication. Your use of, or reliance on, any content is entirely at your own risk and MLA accepts no liability for any losses or damages incurred by you as a result of that use or reliance. No part of this publication may be reproduced without the prior written consent of MLA. All use of MLA publications, reports and information is subject to MLA’s Market Report and Information Terms of Use.
Source:MLA

