

核心要点
牛肉产量达774986吨,创1972年以来同期(9月季度)新高。
羔羊屠宰量降至493万头,为2020年6月季度以来最低,但胴体重量提升6.8%。
绵羊屠宰量同比下滑33.3%,为统计史上第三低的9月季度水平。
澳大利亚统计局(ABS)畜产品数据显示,7–9月最新季度,成年肉牛屠宰量249万头、羔羊493万头、绵羊134万头。
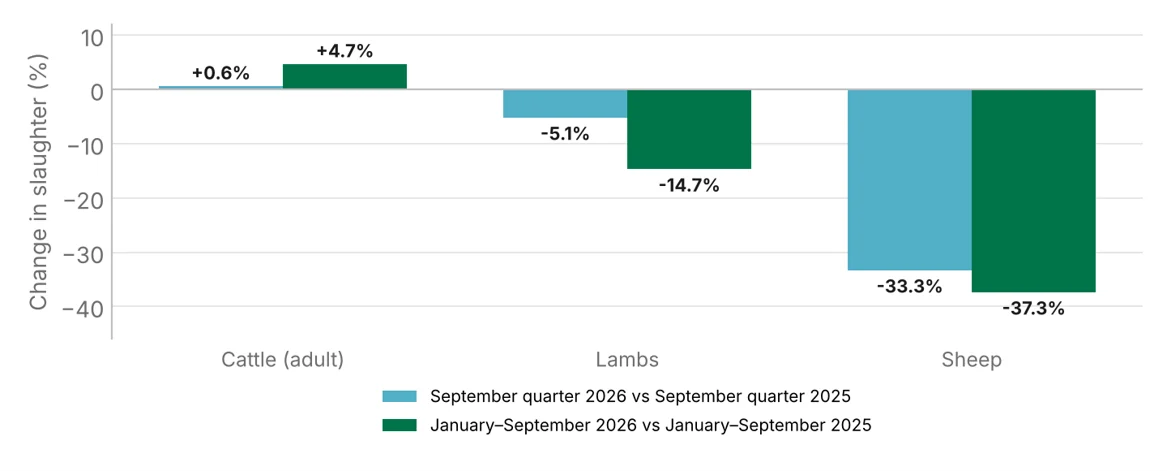
2026年前九个月,肉牛屠宰量较2025年上升4.7%,羔羊屠宰量下降14.7%,绵羊屠宰量下降37.3%。
一个共同特征是胴体增重,三类牲畜的平均胴重均高于去年同期。
2026年9月季度及1–9月各品类屠宰量同比变化
数据来源:澳大利亚统计局(ABS)
牛肉产量创9月季度新高
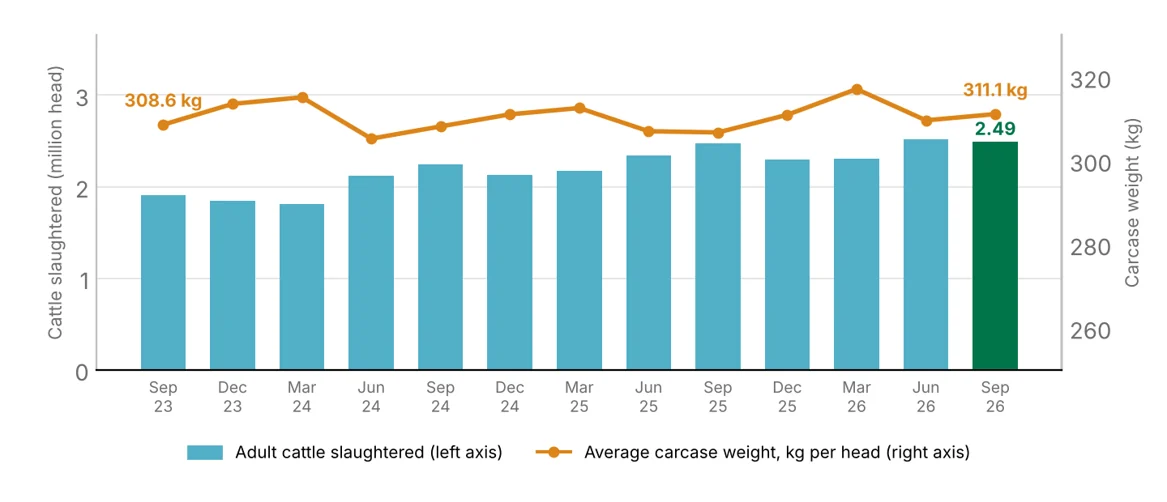
成年肉牛屠宰量较去年9月季度上升0.6%,但较6月季度下降1.2%。
阉牛、青年公牛及公牛合计屠宰121万头,同比增长4.5%,创下1979年3月季度以来季度屠宰新高。母牛与青年母牛屠宰量回落2.8%,至128万头。
成年肉牛屠宰量及平均胴重
数据来源:澳大利亚统计局(ABS)
受此影响,母牛屠宰占比从6月季度的55.0%降至51.2%。这符合年度规律:母牛屠宰占比在6月季度达到峰值,9月季度回落。
昆士兰州屠宰量增长6.3%,至114万头,占全国屠宰总量的45.9%。新南威尔士州、维多利亚州、南澳、西澳和塔斯马尼亚州屠宰量均有所下滑,降幅区间为维多利亚州2.6%至塔斯马尼亚州7.8%。
平均胴重提升1.4%,达到311公斤,带动牛肉产量同比上升2.1%。仅有6月季度780525吨的产量高于本季度。
年初至今,肉牛屠宰量731万头,为统计记录里1–9月同期第三高,仅次于1977年、1978年的历史峰值。
牛肉产量229万吨,同比上涨6.0%,创下该时段历史新高。
羔羊屠宰量降至2020年以来低点
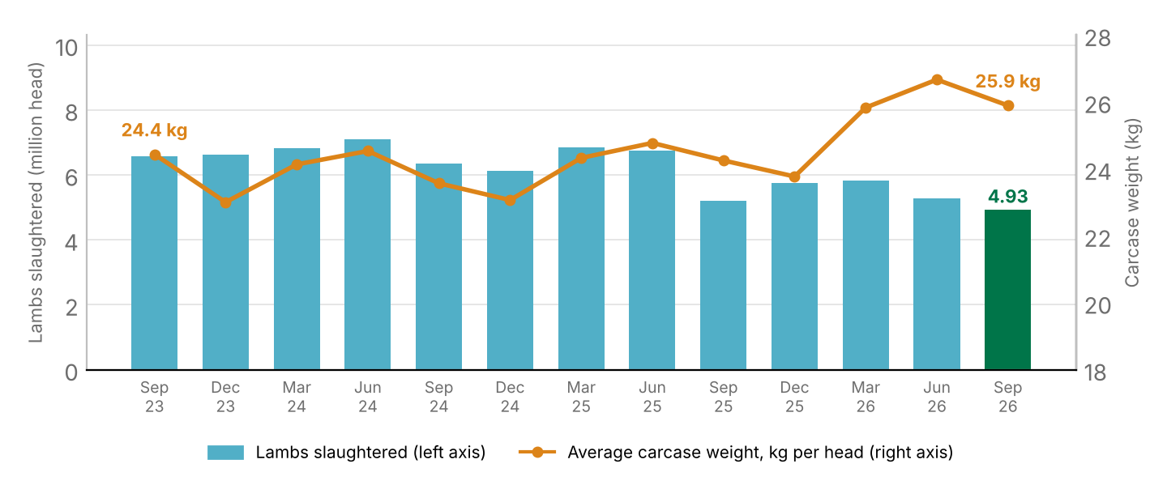
羔羊屠宰总量493万头,较2025年9月季度下降5.1%,较6月季度下降6.7%。
数据来源:澳大利亚统计局(ABS)
羔羊平均胴重达到25.9公斤,同比提升6.8%,支撑羊肉产量至127791吨,较去年同期增长1.3%。6月季度26.7公斤的平均胴重仍是历史最高值。
维多利亚州(263万头)与新南威尔士州(123万头)合计占屠宰总量的四分之三以上,两地屠宰量同比降幅均超7%。与之相反,西澳屠宰量上涨5.6%,塔斯马尼亚州上涨17.6%。
年初至今,羔羊累计屠宰1605万头,较2025年下降14.7%;羔羊肉产量下降8.9%,至419354吨。
绵羊屠宰量下滑三分之一
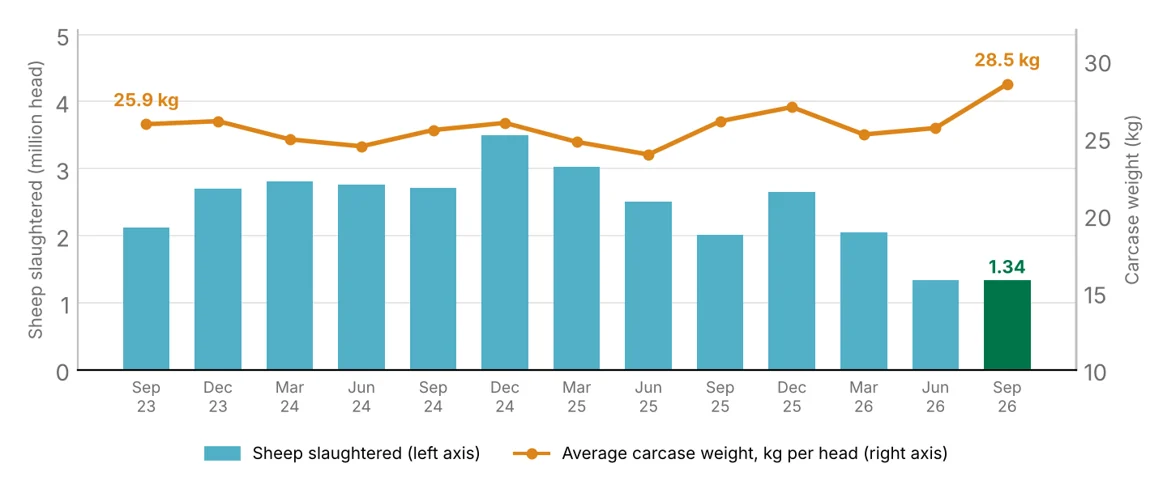
绵羊屠宰量同比下降33.3%,为统计记录中第三低的9月季度屠宰水平,仅高于2011年和2020年,同时也是连续第六个季度同比下滑。
绵羊屠宰量及平均胴重
数据来源:澳大利亚统计局(ABS)
新南威尔士州绵羊屠宰量下降45.0%,至407900头,维多利亚州与西澳均下降28.7%。塔斯马尼亚州是主要州里唯一的例外,屠宰量上涨18.6%。
母羊肉产量同比下降27.1%,至38132吨,为2021年以来9月季度最低水平。绵羊平均胴重达到28.5公斤,同比提升9.2%,创下历史新高。
年初至今,绵羊屠宰量下降37.3%,至472万头;母羊肉产量下滑33.7%,至124060吨。
综合数据来看,肉牛供给保持稳定,依托屠宰规模与胴重提升形成支撑;绵羊与羔羊供给则持续收缩。
供稿:澳大利亚肉类及畜牧业协会(MLA)高级市场信息分析师 埃米利亚诺·迪亚兹
信息发布于2026年11月19日,发布时内容准确。
澳大利亚肉类与畜牧业协会(MLA)不对本刊物所载任何信息的准确性、完整性及时效性作出任何保证。用户使用或依赖本刊物任何内容,风险自行承担;因使用或依赖相关信息所造成的任何损失与损害,MLA概不承担任何责任。未经MLA事先书面许可,本刊物任何内容不得擅自转载、复制。凡使用MLA刊物、报告及相关信息,均须遵守MLA市场报告及信息使用条款。
消息来源:MLA
Heavier carcases reshape September-quarter production
Key points
Beef production reached 774,986 tonnes, the highest September quarter in the series since 1972.
Lamb slaughter fell to 4.93 million head, the lowest since the June quarter 2020. However, carcases were 6.8% heavier.
Sheep slaughter dropped 33.3% year-on-year, the third-lowest September quarter in the series.
The Australian Bureau of Statistics (ABS) Livestock Products data showed 2.49 million adult cattle, 4.93 million lambs and 1.34 million sheep were slaughtered in the latest July to September quarter.
Over the first nine months of the 2026 calendar year, cattle slaughter was 4.7% higher than in 2025, lamb slaughter was 14.7% lower and sheep slaughter was 37.3% lower.
Heavier carcases were the common thread, with average weights above year-earlier levels for all three species.
Year-on-year change in slaughter, September quarter 2026 and January–September 2026, by species
Source: ABS.
Beef production reaches a September-quarter high
Adult cattle slaughter was 0.6% above the September quarter last year, but 1.2% below the June quarter.
Steers, bullocks and bulls totalled 1.21 million head, up 4.5% year-on-year and the highest quarterly kill since the March quarter recorded in 1979. Cow and heifer slaughter eased 2.8% to 1.28 million head.
Adult cattle slaughter and average carcase weight
Source: ABS
As a result, the female slaughter rate fell to 51.2% from 55.0% in the June quarter. This follows the annual pattern of females peaking in the June quarter and easing in the September quarter.
Queensland slaughter increased by 6.3% to 1.14 million head, or 45.9% of the national kill. Slaughter was lower in NSW, Victoria, SA, WA and Tasmania, ranging from a 2.6% decrease in Victoria to 7.8% in Tasmania.
Average carcase weight rose 1.4% to 311 kilograms, lifting beef production 2.1% above the same quarter metrics as the previous year. The June quarter at 780,525 tonnes is the only quarter to have recorded a higher volume.
Year-to-date, cattle slaughter of 7.31 million head was the third-highest January to September total in the series, behind the 1977 and 1978 records.
Beef production of 2.29 million tonnes, up 6.0%, was the highest for the period in the series.
Lamb slaughter eases to its lowest since 2020
Lamb slaughter totalled 4.93 million head, 5.1% below the September 2025 quarter last year and 6.7% below the June quarter.
Source: ABS
Average carcase weight reached 25.9 kilograms, 6.8% higher year on year. This supported production of 127,791 tonnes, 1.3% above the same quarter last year. The June quarter's 26.7-kilogram average carcase weight remains the highest in the series.
Victoria (2.63 million head) and NSW (1.23 million head) accounted for more than three-quarters of the kill, and both were more than 7% lower year-on-year. In contrast, slaughter rose 5.6% in WA and 17.6% in Tasmania.
Year-to-date, lamb slaughter totalled 16.05 million head, down 14.7% from 2025 while lamb meat production fell 8.9% to 419,354 tonnes.
Sheep slaughter drops by one-third
Sheep slaughter recorded a 33.3% decline on last year and was the third-lowest September-quarter kill in the series, behind 2011 and 2020. It was the sixth consecutive quarter of year-on-year decline.
Sheep slaughter and average carcase weight
Source: ABS
NSW slaughter fell 45.0% to 407,900 head, while Victoria and WA each fell 28.7%. Tasmania was the exception among the major states, up 18.6%.
Mutton production fell 27.1% year-on-year to 38,132 tonnes, the lowest September-quarter total since 2021. Average carcase weight reached 28.5 kilograms, up 9.2% from a year earlier and the highest in the series.
Year-to-date, sheep slaughter fell 37.3% to 4.72 million head, while mutton production declined 33.7% to 124,060 tonnes.
Together, the data indicates cattle supply holding firm, supported by higher throughput volumes and heavier carcases, while sheep and lamb supply continue to contract.
Attribute content to: Emiliano Diaz, MLA Senior Market Information Analyst.
Information is correct at time of publication on 19 November 2026
MLA makes no representations as to the accuracy, completeness or currency of any information contained in this publication. Your use of, or reliance on, any content is entirely at your own risk and MLA accepts no liability for any losses or damages incurred by you as a result of that use or reliance. No part of this publication may be reproduced without the prior written consent of MLA. All use of MLA publications, reports and information is subject to MLA’s Market Report and Information Terms of Use.
Source:MLA

